Variphy Zoom Phone Analytics: Four Zoom Phone Dashboard Widgets to Know
Regardless of the UC platform(s), if your organization is like most others we work with, you’re likely using hunt groups or call queues. How do you prefer to track their performance? When are the busy hours? Is each queue staffed appropriately?
Many organizations come to us because they need better visibility in these areas:
- Call volumes by time of day, day of the week, or other time intervals
- Handling, workload, or distribution rates among users/agents assigned to receive the calls
- Key performance metrics such as call counts, average durations, and abandon rates
Variphy’s dashboards and widgets allow Zoom Phone users to visualize call queue activity in several ways — and it’s customizable to fit your needs.
The Zoom Phone widgets I discuss in this post can be added to Variphy dashboards with the following customization options:
- Appearance: colors, font sizes, title, icon, and size (via drag and drop)
- Time Period: from the Current Hour only to the Previous Quarters or virtually anything in between
- Data Set: select one or multiple call queues for the widget presentation
By Time Period
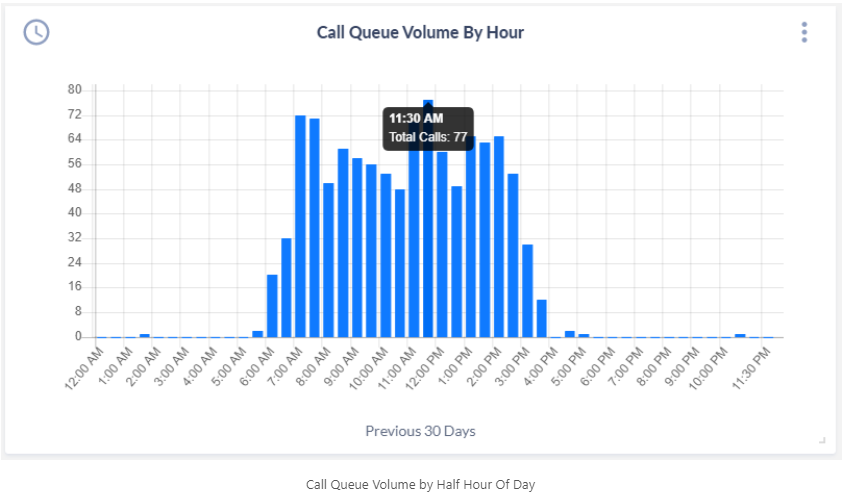
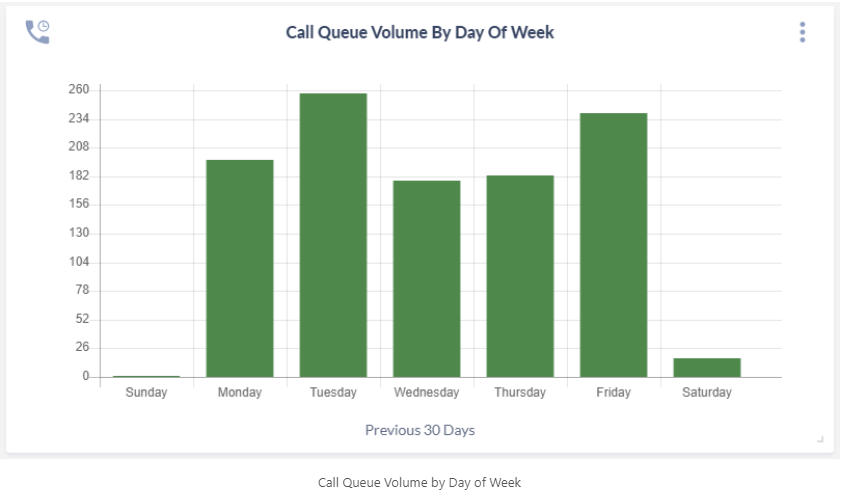
Total calls to the call queues can be organized by several time interval types, such as Hour of Day, Date, Week, Day of Week, or even Quarter Hour of Day (every 15 minutes).


By Agent
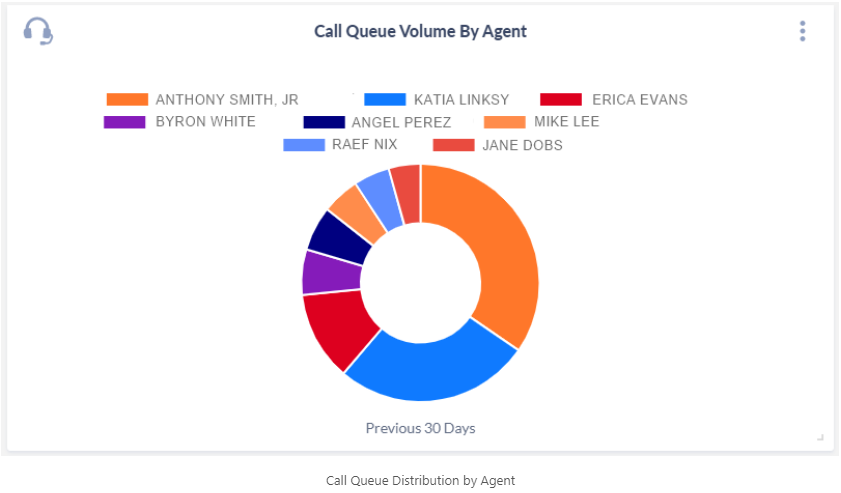
The Call Distribution widget type shows how many calls each user/agent received relative to one another. An optional maximum number of groupings can also be configured.

Statistics and Performance-Based
The Grouping Statistics widget type can group call activity by the called User/Agent or one of many other grouping options. You can choose from and order dozens of options.
Want to learn more about Variphy Call Analytics for Zoom Phone? Check out our recorded and upcoming weekly workshops here!